Senaste resultat
 1 KFUM Norrköping
 3 Dam A
 3 VBF RIG Falköping C2 Herr A
 3 Degerfors VBK Orion B0 Dam B3 Gothia VBK C0 Herr B
Nyheter från våra lag
Säsongen är slut, snart dags för beachvolley
Ungdom P/F - 2 maj 2023
Träning lördag 15e april
Ungdom P/F - 13 apr 2023
Ingen kidsträning lördag 18/2
Ungdom P/F - 17 feb 2023
Ny träningstid och plats på lördag!
Herr B - 25 jan 2023
Kidsträning lördag 21/1
Ungdom P/F - 20 jan 2023
Välkommen till oss!
TVK har funnits i 40 år i år och har alltid varit en smältpott av olika kulturer. Och detta gäller fortfarande: vit, brun, svart, gul, rosa, erfaren, oerfaren, oavsett hur ditt hår ser ut: hos oss är alla välkomna!
Vill du börja spela volleyboll, eller har du redan spelat någon annanstans? Kom bara till en av prova-på träningar och bli en del av en rolig grupp människor.
Mer information hittar du här.
TVK has been around for 40 years this year and has always been a melting pot of different cultures. And this still applies: white, brown, black, yellow, pink, experienced, inexperienced, no matter what your hair looks like: with us everyone is welcome!
Do you want to start playing volleyball, or have you already played elsewhere? Just come to one of the try-out trainings and become part of a fun group of people.
Click here for more information.
Dam A seriesegrare 23/24!
25 mar, 12:55 1 kommentar
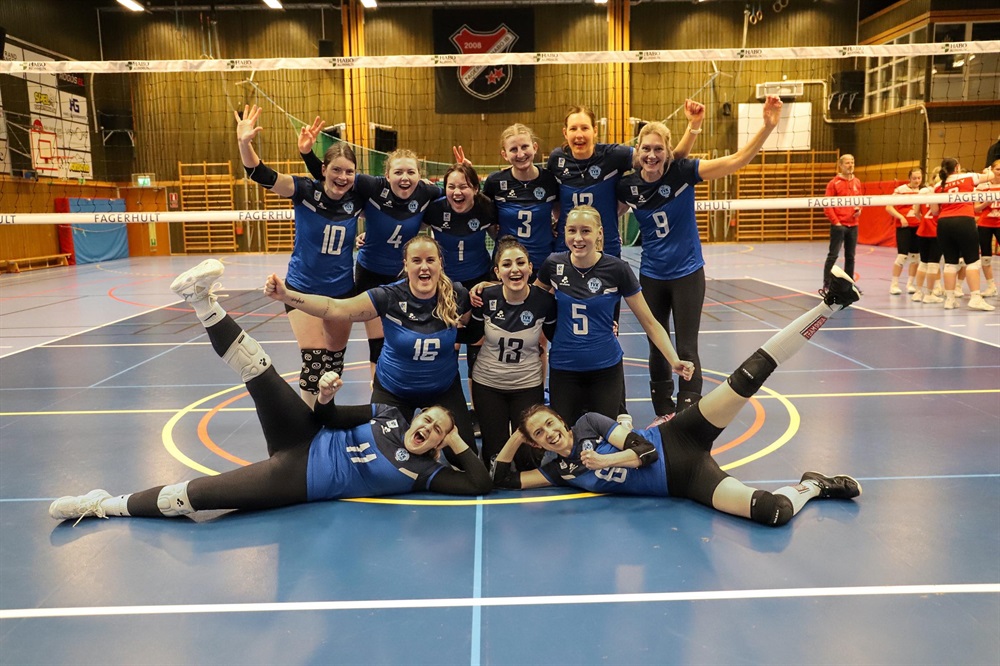 Glada tjejer efter att seriesegern säkrades i allra sista omgången
Dam A säkrar seriesegern i säsongens sista matchomgång genom en stabil vinst med 3-0 mot serieledande Karlstad VK!
Säsongens sista hemmamatcher för Herr A!
21 mar, 12:59 0 kommentarer
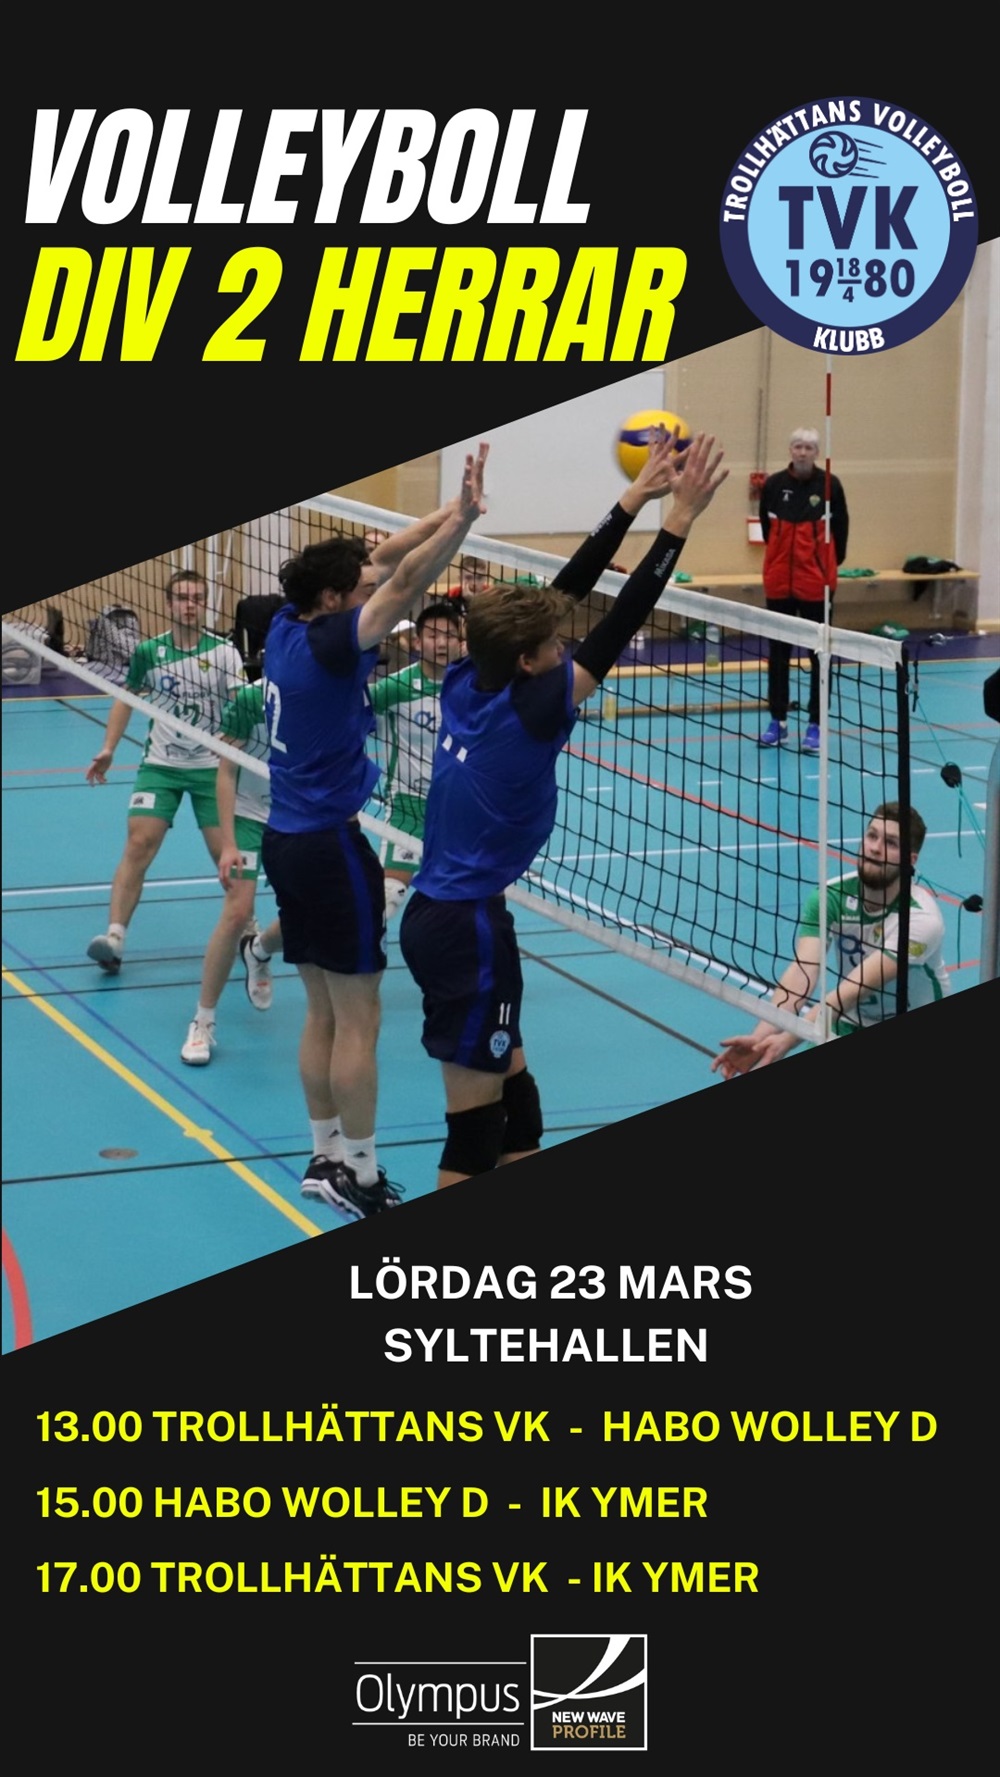
Herr A spelar säsongens sista hemmamatcher nu på lördag 23 mars i Syltehallen. De möter Habo Wolley D kl 13:00 och IK Ymer kl 17:00.
Kiosken är öppen som vanligt!
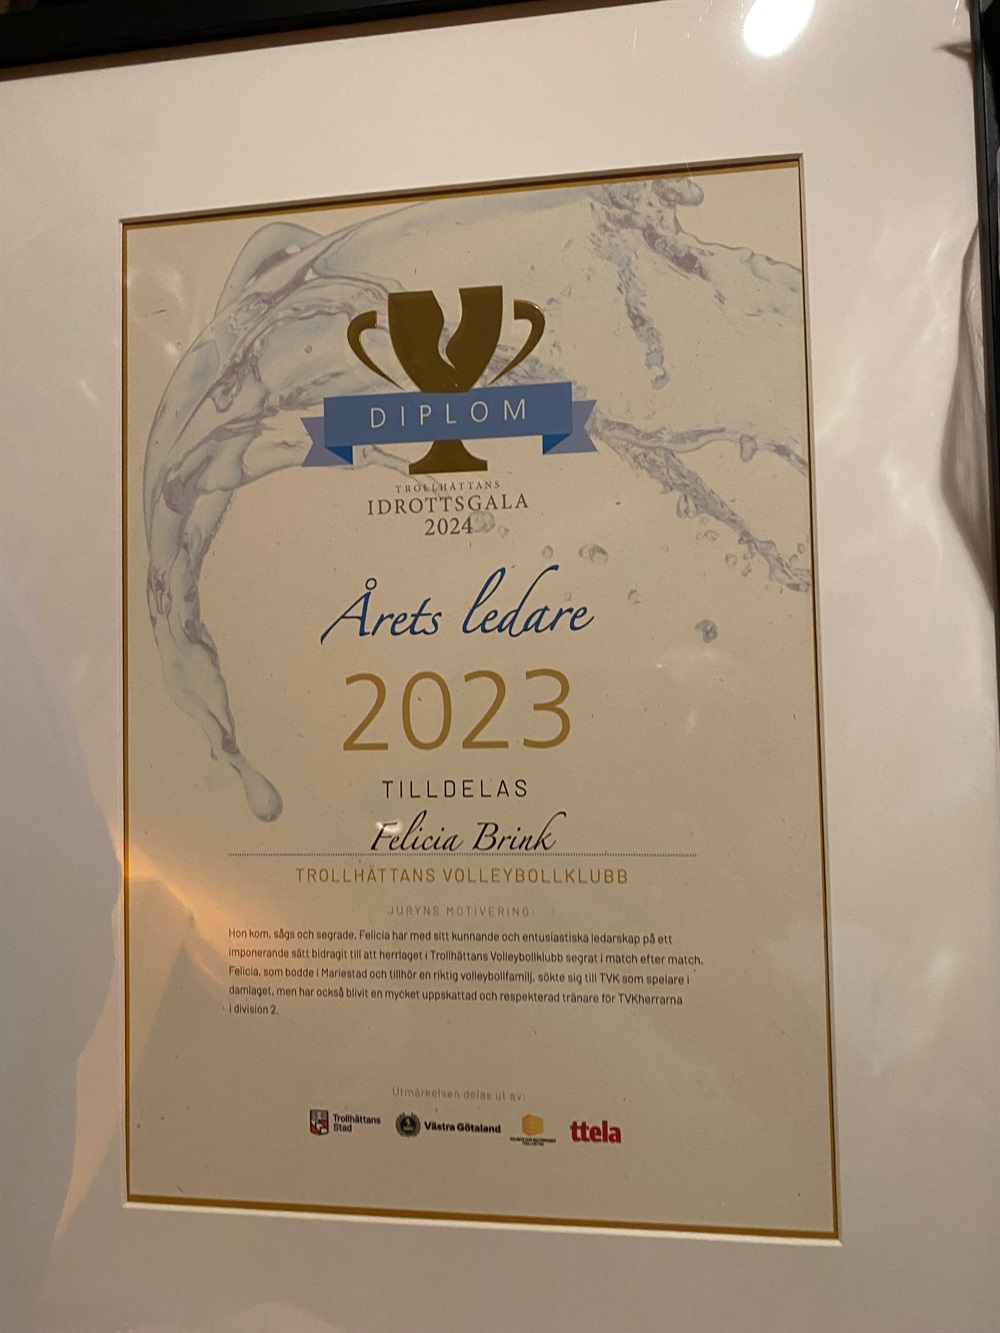
Årets Ledare!!!!
15 mar, 21:31 1 kommentar
Volleyboll-EM 2026 till Sverige – gruppspel avgörs i Göteborg
6 mar, 07:09 0 kommentarer
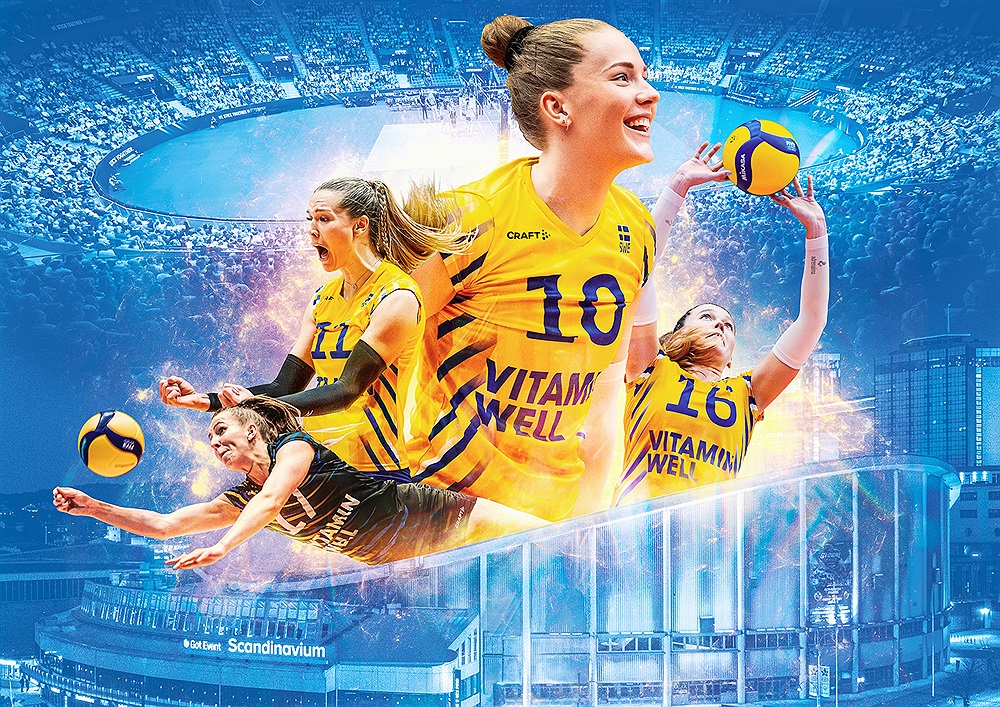 Foto: Robert Boman och Christoffer Borg Mattisson. Montage: Joakim Bengtsson.
Sverige och Göteborg får den historiska äran att arrangera damernas Volleyboll-EM 2026 tillsammans med...
Dam B spelar hemma 14 januari
9 jan, 15:57 0 kommentarer
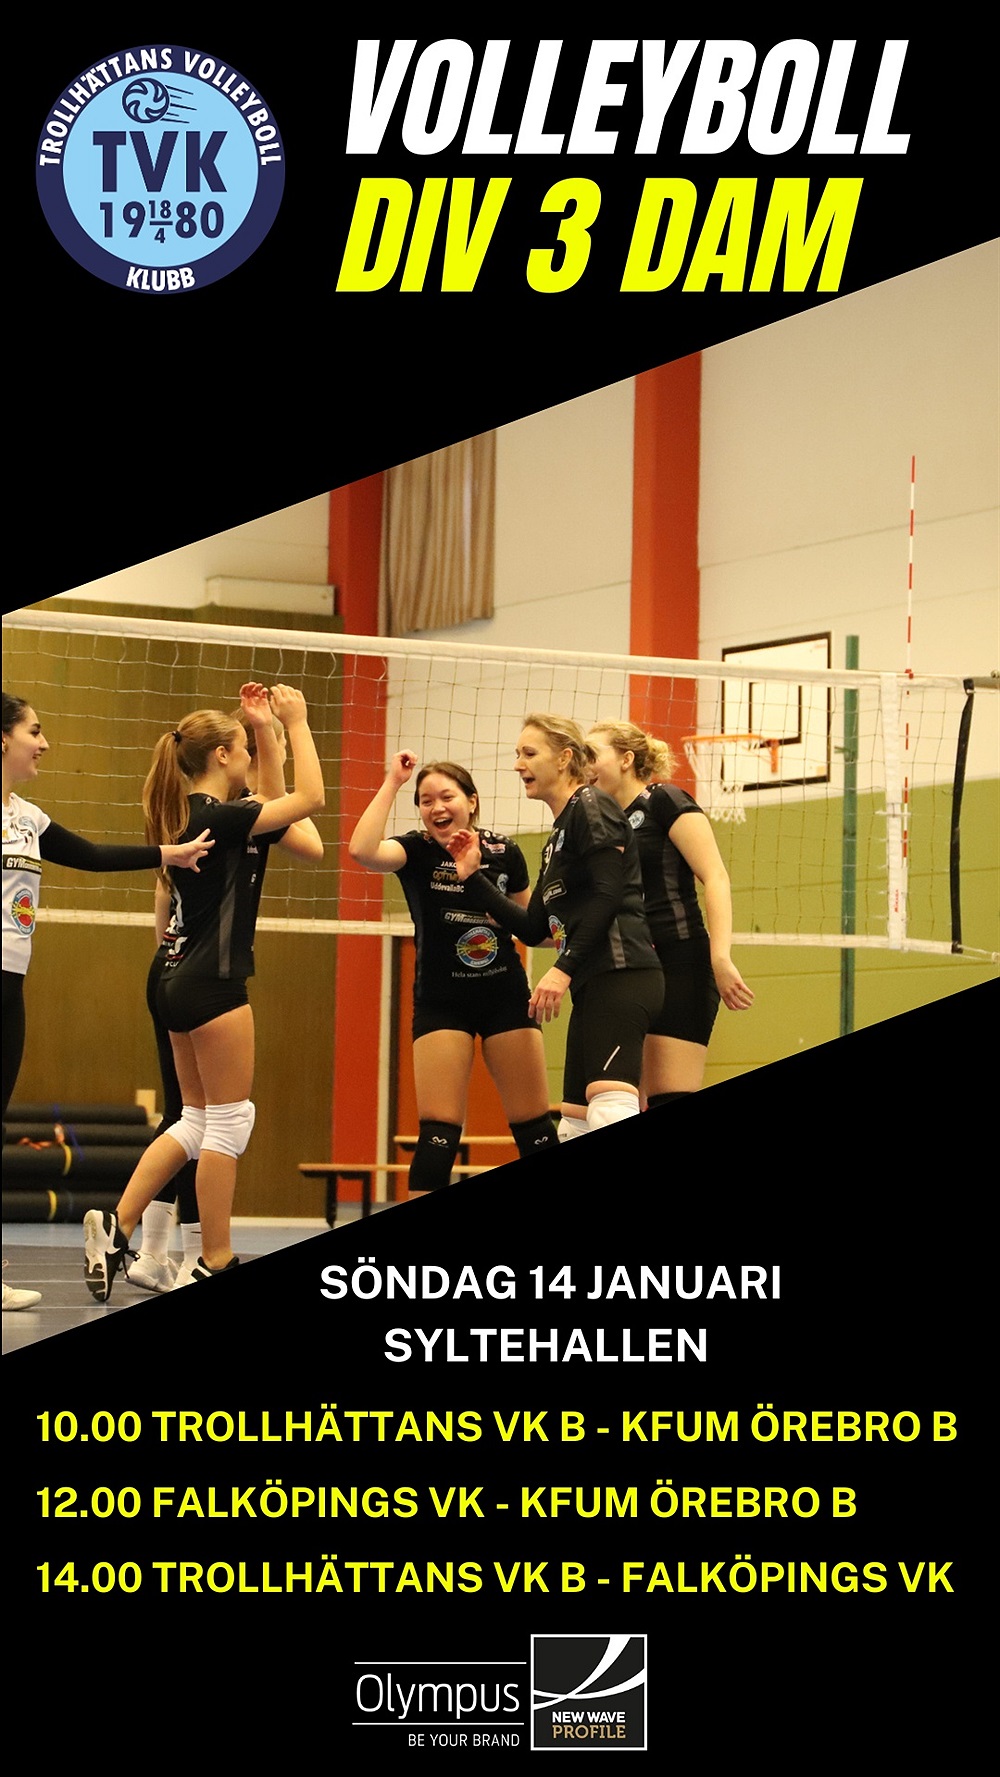
Även Dam B spelar hemma i helgen - söndag 14 januari möter de serieledande KFUM Örebro B och tabellfyran Falköpings VK i Syltehallen. Det kommer bli två tuffa men roliga matcher!
Som vanligt är kiosken öppen så du kan köpa fika när du hejar på tjejerna.
Matchstart kl 10:00 och kl 14:00.
Fler nyheter


Kommande matcher
| Inga matcher finns inbokade |
Senaste resultat
|
Lör 9/3
15:00 |
KFUM Norrköping Hagagymnasiet |
1-3 |
|
Lör 9/3
14:00 |
Degerfors VBK Orion B Stora Vallahallen |
3-0 |
|
Lör 9/3
14:00 |
Degerfors VBK Orion B Stora Vallahallen |
3-0 |
|
Lör 9/3
13:00 |
Dam A Hagagymnasiet |
3-1 |
|
Sön 3/3
15:00 |
Karlstads VK C Mariebergshallen, Karlstad |
3-0 |
|
Sön 3/3
15:00 |
Karlstads VK C Mariebergshallen, Karlstad |
3-0 |
|
Sön 3/3
13:00 |
Dam B Mariebergshallen, Karlstad |
0-3 |
|
Sön 3/3
13:00 |
Dam A B Mariebergshallen, Karlstad |
0-3 |
Kommande aktiviteter
|
Tis 23/4
17:30-19:00 |
Herr A »
Träning
Syltehallen |
|
Tis 23/4
17:30-19:00 |
Dam C »
Träning
Syltehallen |
|
Tis 23/4
17:30-19:00 |
Ungdom P/F »
Inomhusträning kids P/F
Syltehallen Trollhättan |
|
Tis 23/4
18:45-20:30 |
Dam A »
Träning
Syltehallen |
|
Tis 23/4
20:30-22:00 |
Herr B »
Träning
Syltehallen |
|
Tor 25/4
16:30-17:45 |
Dam C »
Träning
Torsbohallen |
|
Tor 25/4
16:30-17:45 |
Ungdom P/F »
Inomhusträning Kids P/F
Torsbohallen Trollhättan |
|
Tor 25/4
17:45-19:30 |
Herr B »
Träning
Torsbohallen |
|
Tor 25/4
17:45-19:30 |
Dam A »
Träning
Torsbohallen |
|
Tor 25/4
20:00-22:00 |
Herr A »
Träning
Granngården |